programming challenges
Tech Stack
The application had to be dynamic and responsive to multiplayer user inputs, so we chose React with Redux as the front-end framework, coupled with Socket.io for real-time client interactions and GitHub OAuth for authentication. The server-side code was written using Node and Express, with a RESTful API that connects to a PostgreSQL database. The code evaluating user-submitted solutions was separated into its own microservice, leveraging two Redis-based queues, to increase performance and robustness.
Introduction
Practicing programming is often a grind: toy problems are dull and lonely, and progress is not easily measured. BattleCode kindles a competitive drive in coding, where programmers can test their skills against each other in head-to-head, real-time challenges. Click here to try it yourself!
Logo
Overview
BattleCode offers a platform through which aspiring and professional programmers can grow in their coding skills. Users can compete against each other in Arena Mode to find a valid solution to a given problem in the shortest amount of time. During the challenges, users can see the real-time progress of their opponent as they explore their own solution, and upon completion, their scores are placed into a leaderboard which keeps track of the top solutions for each problem. After a user finishes a challenge, he or she then has access to that challenge in the Training Mode, which offers users a way to replay challenges as many times as they want.
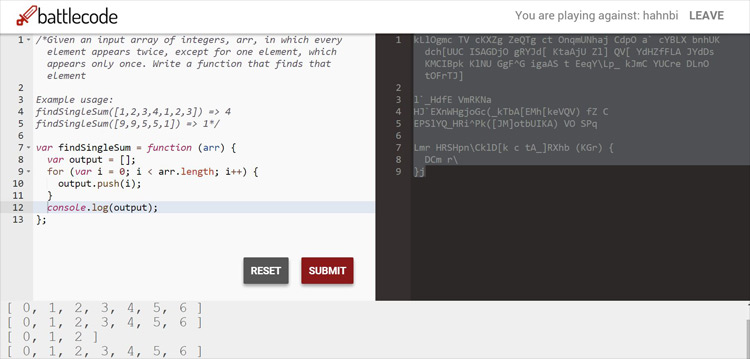
Arena Mode
Players also have a BattleCode profile that measures their performance. Players can log in using their GitHub accounts, which automatically imports information from their GitHub profiles. Their match histories and win-loss records are displayed in their profiles, and an Elo rating, which indicates their relative skill levels, gives them a metric to help mark their progress.
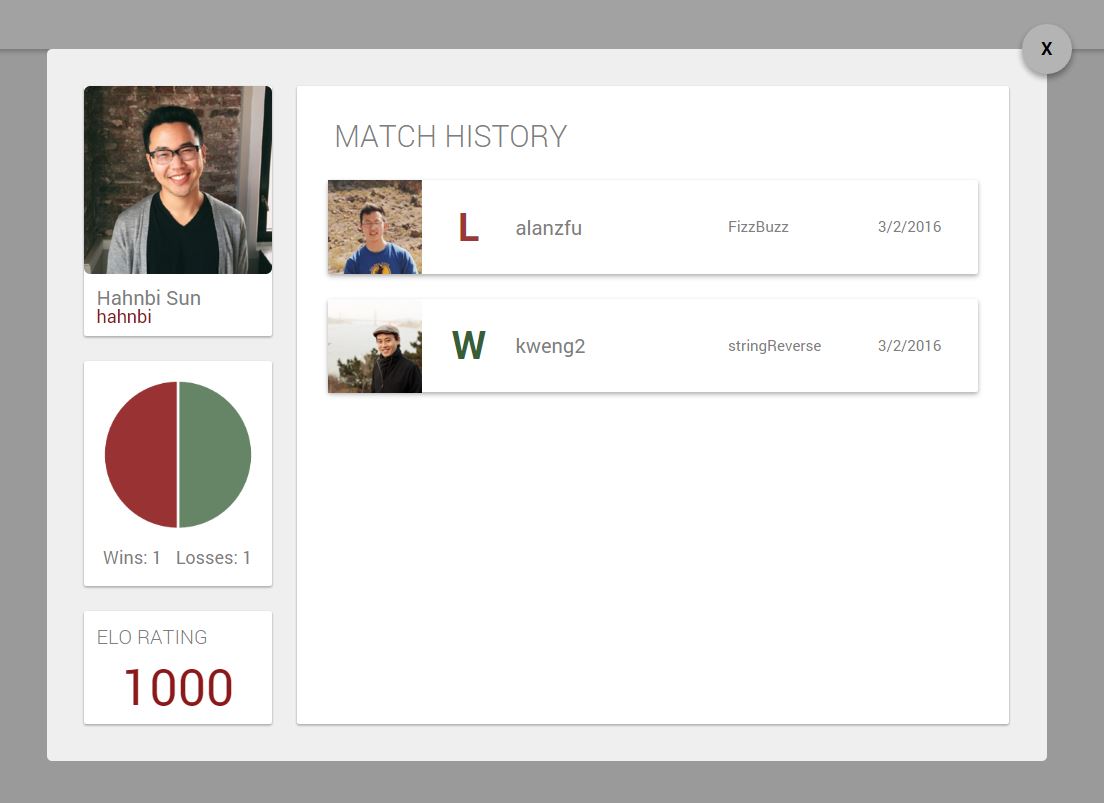
Profile
marking nearby crimes
Tech Stack
The front-end functionality was developed using React, integrating the Google Maps API to visualize maps and markers and the Google Places API for location autocompletion. The web server was coded with Node and Express, connecting to MongoDB records using the Mongoose ORM.
Introduction
When walking home at night while alone or in an unfamiliar area, personal safety becomes an issue. Crime Reporter attempts to aid people in these situations by allowing users to identify potentially dangerous neighborhoods to avoid.
Overview
Crime Reporter offers two main features. The first feature is the crime-reporting functionality. Users can search for locations and then report a crime, optionally adding a comment or brief note. These values are stored individually for each user for future reference. The second feature is the interactive map, which aggregates the reported crimes. By drawing upon the data submitted by all users, the resulting heat map clearly outlines locations in which crime is common, and the visualized data points can be filtered based on category.
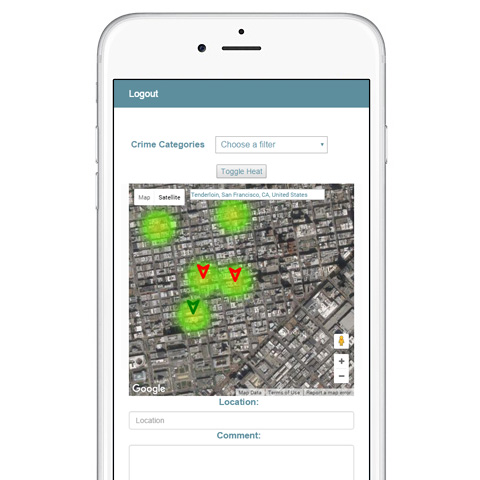
Interactive heat map
enjoying homecooked meals
Tech Stack
The web server uses Node and Express to route RESTful API calls that fetch the desired subsets of MongoDB data. The Mongoose ORM wrapped these interactions for clean and maintainable code. The front-end of the application was coded with Angular, using the ui-router for routing and nested views to achieve a seamless user experience.
Introduction
For young, urban professionals who spend most of their lives pursuing career ambitions and other hobbies, home-cooked meals can be hard to come by. Homecooked helps connect those who like cooking with those who desire the comforts of home cooking.
Overview
Homecooked caters not only to people in search for a meal, but to cooking enthusiasts as well. Cooks can submit their meals through a form on the application, including a description, image, and even the dates and times of availability. The submissions will then be featured on the main page, where other users can browse and connect with the home cook.
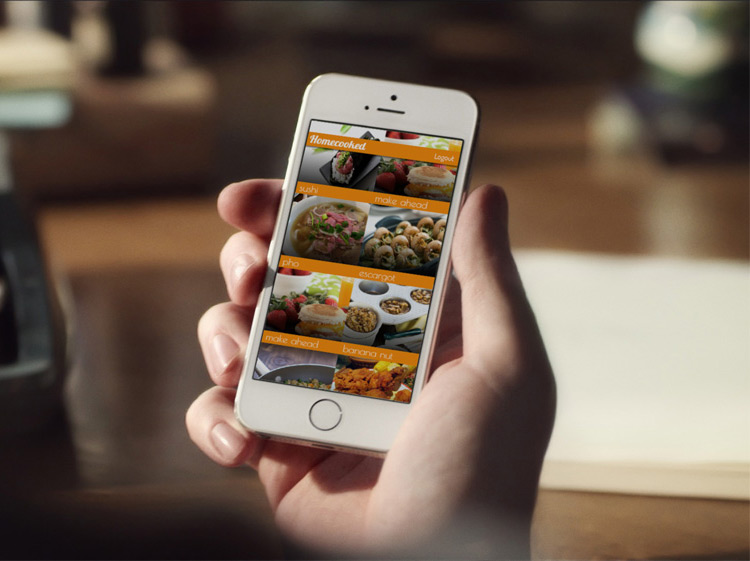
Main page
departmental metrics
Tech Stack
The application was built using the ASP.NET MVC framework. The front-end included JavaScript to adjust the search parameters and build the interface (using the jQueryUI library), and various data visualizations were generated using the Google Charts API. On the backend, the application fetched data from several different types of databases, including SQL, OLAP, and OSIsoft PI (accessed through the OSIsoft PI Web API and OSIsoft AFSDK).
Introduction
Gathering metrics to assess performance is an important part of any process, but arguably more important is actually acting on the data. While many companies operate retrospectively on their data, the purpose of this dashboard was to provide immediate insight in order to proactively allocate resources as needed. Through real-time visibility into these metrics, newly-introduced initiatives ultimately increased performance in some areas by 30%.
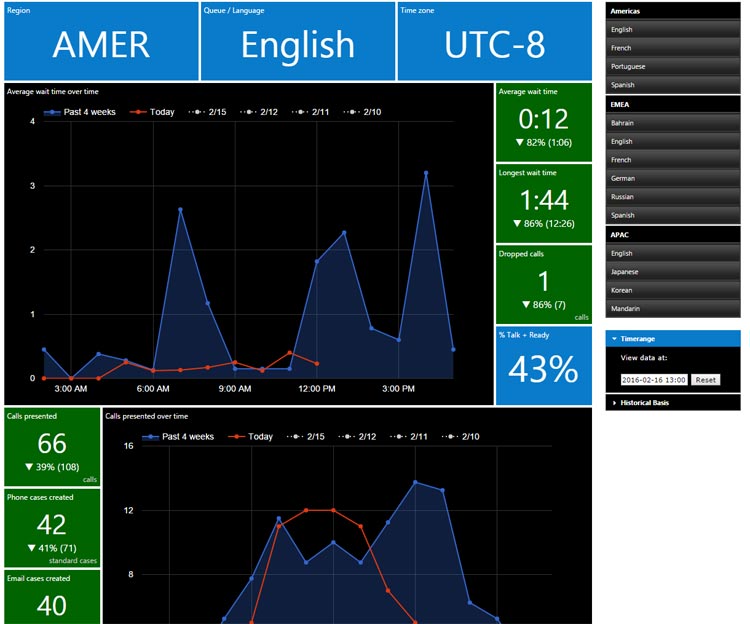
Region dashboard
Overview
The goal of this dashboard was initially to display a high-level overview of certain call center metrics by region. At first, the dashboard presented summary calculations, such as daily averages or maximums. In order for the metrics to be more immediately actionable, the functionality quickly expanded to include a more comprehensive breakdown of some metrics for each hour throughout the day, and some of the tiles could be double-clicked to reveal a more in-depth view at the data. Additionally, these data points could be compared to historical data for up to the past three months. Finally, a historical playback feature was introduced to generate data at a specified point in time.
Introduction
In late 2012, as part of a marketing push, the folks over at Reach Pilates commissioned a redesign of their website, which became one of my first jobs as a freelance web developer. This project is listed here mainly as a baseline to which I can compare my current skills.
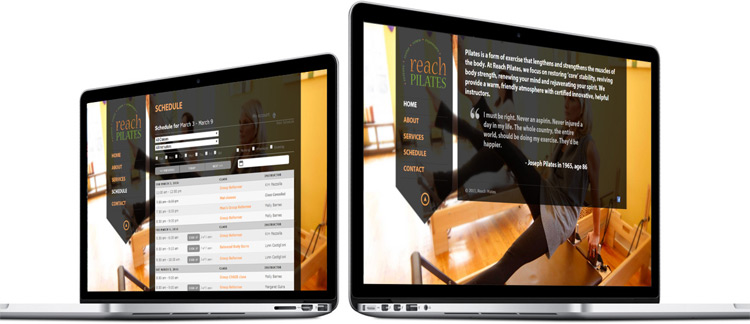
Website screenshots
Overview
The redesign of the website had two main goals. First, generating a new, vibrant look would aid in attracting new clientele. Photos of the space had great colors and lighting, so they were used as background images for the main pages. Second, integrating a third-party scheduling application would empower customers to easily register for appointments. The application was incorporated and painted over with a color scheme to fit the rest of the website.
for my latest work